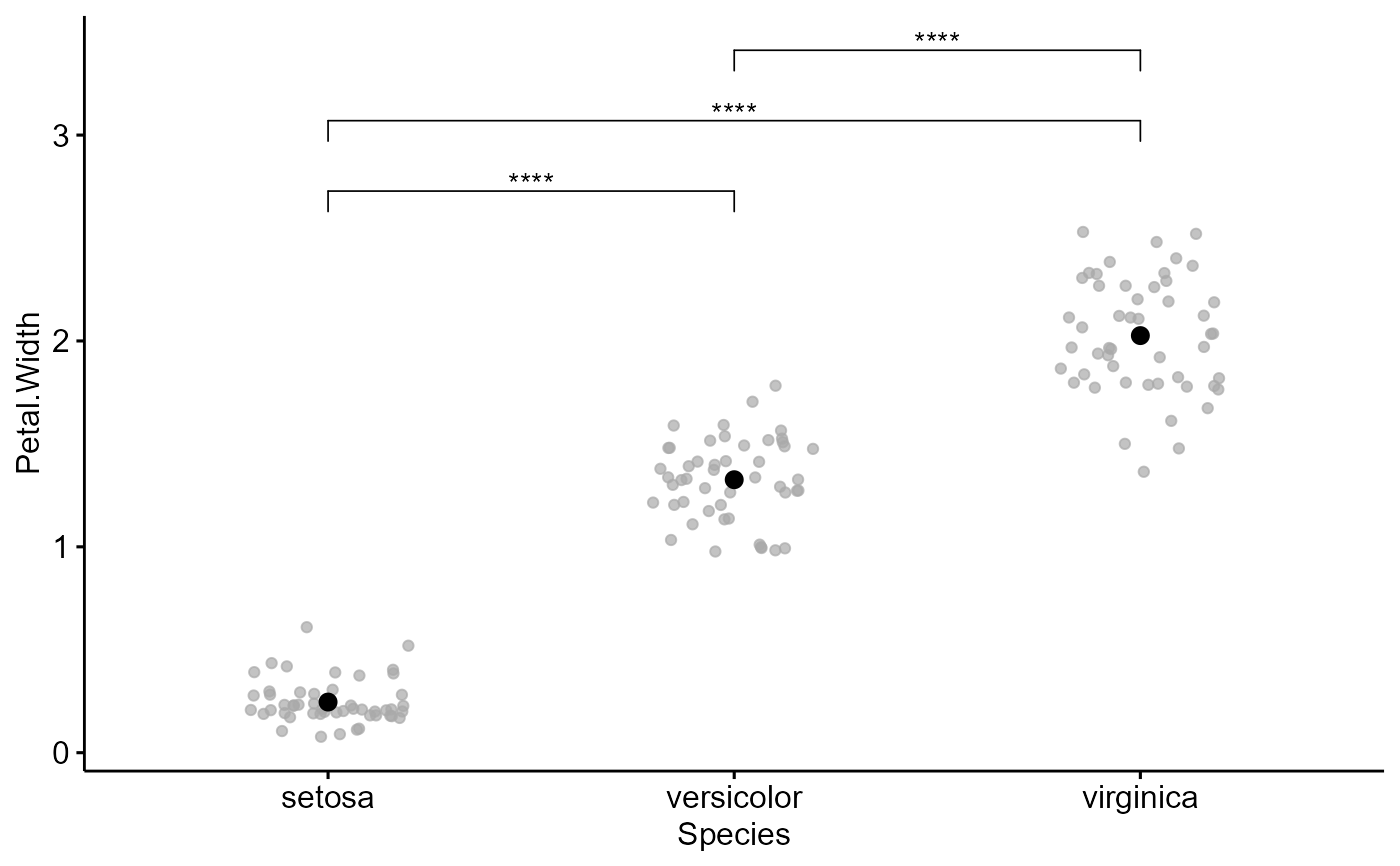
Lineplot con los valores de p obtenidos con emmeans de un LM, LMM, GLM, GLMM, etc. Gráficos generados con paqueteria "ggplot", por ahora solo permite una variable explicativa sin interacciones.
Arguments
- formula
Formula de los contrastes que nos interesan obtener.
- modelo
Modelo LM, GLM, GLMM, etc.
- data
Base de datos con que se ajusto el modelo.
- p.adjust.method
método para ajustar los valores p para comparaciones múltiples. Se utiliza cuando se realizan comparaciones por pares. Los valores permitidos incluyen "holm", "hochberg", "hommel", "bonferroni", "BH", "BY", "fdr", "none". Si no desea ajustar el valor p (no recomendado), utilice p.adjust.method = "none".
Examples
data(iris)
mod <- glm(Petal.Width ~ Species, family = gaussian("log"), data=iris)
lineplot_emmeans(formula = Petal.Width ~ Species, modelo=mod, data= iris)
#> Warning: The `fun.y` argument of `stat_summary()` is deprecated as of ggplot2 3.3.0.
#> ℹ Please use the `fun` argument instead.
#> ℹ The deprecated feature was likely used in the ggpubr package.
#>   Please report the issue at <https://github.com/kassambara/ggpubr/issues>.
#> Warning: The `fun.ymin` argument of `stat_summary()` is deprecated as of ggplot2 3.3.0.
#> ℹ Please use the `fun.min` argument instead.
#> ℹ The deprecated feature was likely used in the ggpubr package.
#>   Please report the issue at <https://github.com/kassambara/ggpubr/issues>.
#> Warning: The `fun.ymax` argument of `stat_summary()` is deprecated as of ggplot2 3.3.0.
#> ℹ Please use the `fun.max` argument instead.
#> ℹ The deprecated feature was likely used in the ggpubr package.
#>   Please report the issue at <https://github.com/kassambara/ggpubr/issues>.
#> Warning: Computation failed in `stat_summary()`
#> Caused by error in `get()`:
#> ! object 'mean_se_' of mode 'function' was not found

#> # A tibble: 3 × 7
#>   group1     group2        df statistic        p    p.adj p.adj.signif
#>   <chr>      <chr>      <dbl>     <dbl>    <dbl>    <dbl> <chr>
#> 1 setosa     versicolor   147     -14.1 4.84e-29 1.45e-28 ****
#> 2 setosa     virginica    147     -17.8 1.74e-38 5.22e-38 ****
#> 3 versicolor virginica    147     -16.3 1.22e-34 3.67e-34 ****
#> # A tibble: 3 × 7
#> group1 group2 df statistic p p.adj p.adj.signif
#> <chr> <chr> <dbl> <dbl> <dbl> <dbl> <chr>
#> 1 setosa versicolor 147 -14.1 4.84e-29 1.45e-28 ****
#> 2 setosa virginica 147 -17.8 1.74e-38 5.22e-38 ****
#> 3 versicolor virginica 147 -16.3 1.22e-34 3.67e-34 ****